
With the start of the new year 2021, it is also time for me to make some changes in my weekly statistic. In todays post, I will guide you through the changes I have made.
Doing this weekly statistic for one and a half years already, the start of the new year 2021 is also a time where I need to update my statistic and adapt it to my new kind of lifestyle that is about to get started. What? Which new lifestyle? What are you even talking about? Well, here it is!
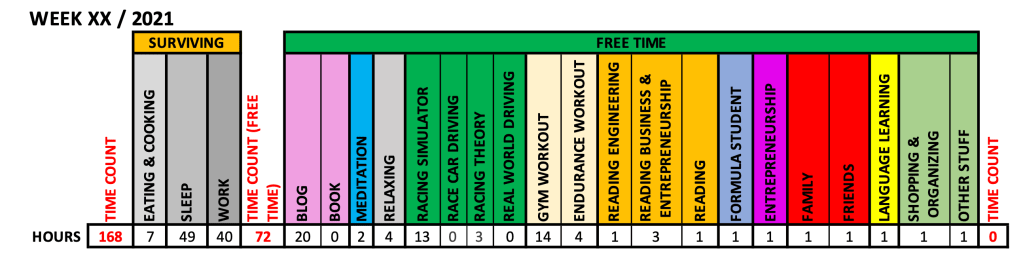
As you can see in the picture above, the layout pretty much looks like the old one. Sure, the system had done its job, therefore, why changing it, right? But indeed, I needed to change some of the categories.
Instead of just tracking the time for me doing my blog project, I also wanted to document the time I will spend for my book. Therefore, I have introduced a blog and a book section. While meditation and relaxing should be still a thing in 2021, the racing category got another section focusing specifically on the theory behind racing and motorsport and founding a racing team and all of this. Sport will be the same, but now comes the bigger changes. With my master program ending very soon at the end of February and the fact, that I hadn’t had any lectures in the last half year, I don’t need the University category any longer. That’s the reason, why it got exchanged by reading, which is separated into three sections now. Engineering, Business & Entrepreneurship and normal reading, like fiction/ non fictions stuff outside the other two topics. Why? Because it’s important for me to keep on working on my skills even after leaving university. Formula student stays the same, I am still supporting the team as an Adviser and spending some time with it, but now comes something new again, the category ENTREPRENEURSHIP. Well, the idea behind this is the pure fact that I want get more involved into those topics and want to actually start doing more business wise, focusing on this specifically. Yeah, and that’s pretty much it! The other categories stay the same!
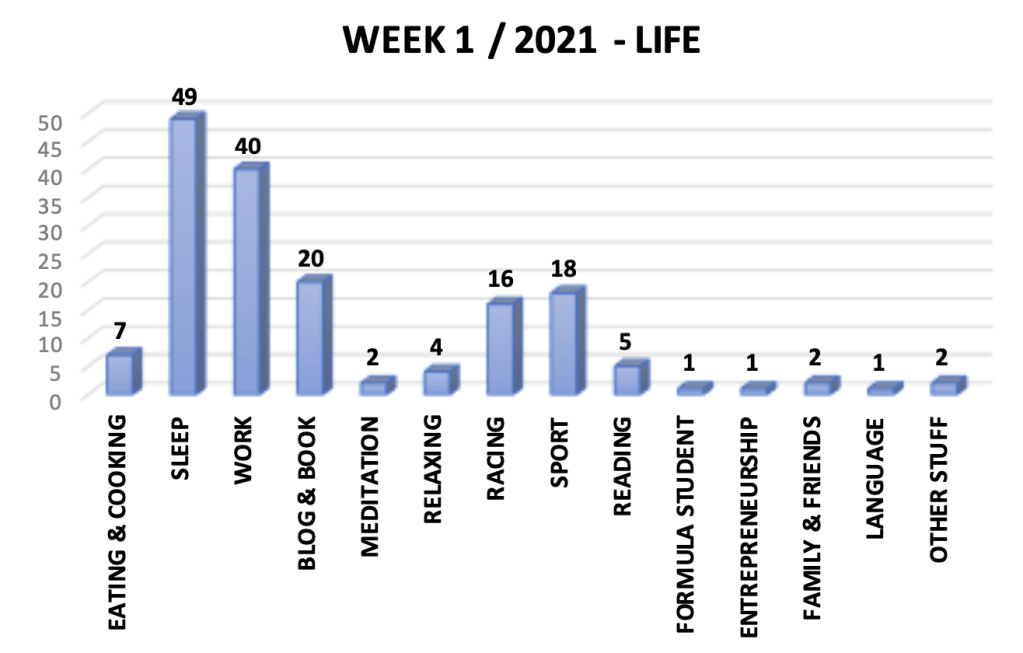
As you can see, the overall categories have not really changed, but for sure, it will be possible for me to go more into the details after looking at each individual section by itself. But before doing this, we will focus on the LIFE section!
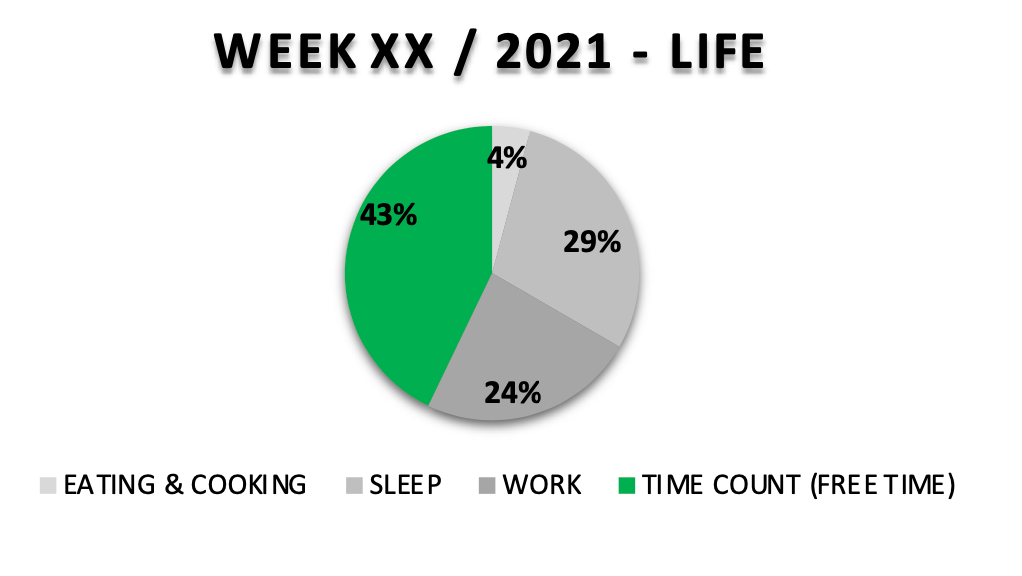
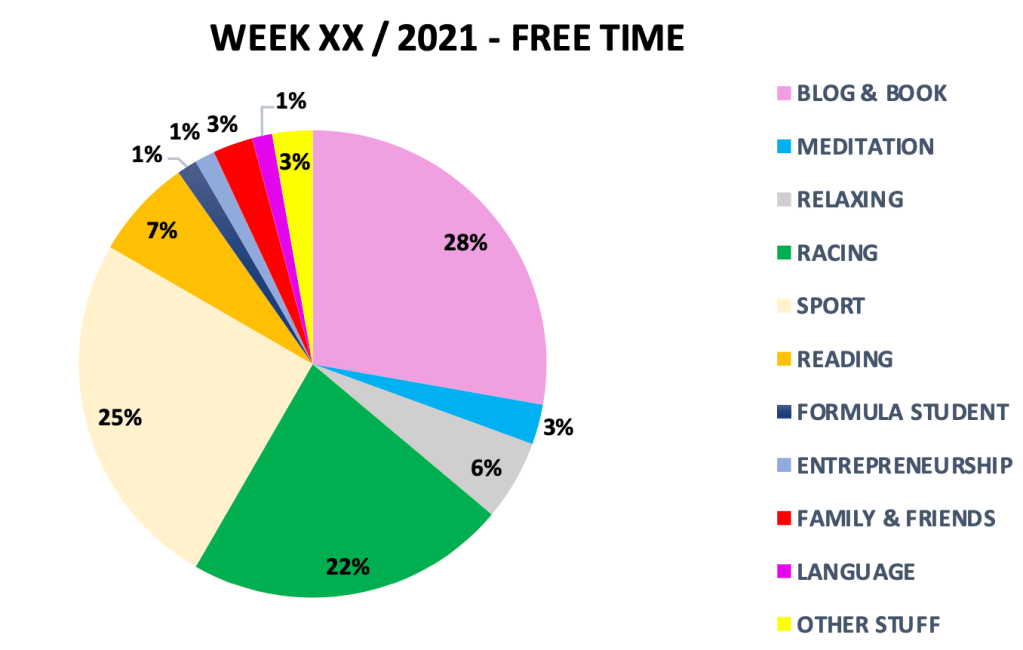
This chart should be familiar with you already, because it was there last year as well. You can basically see how much percent of my time I eat & cook, sleep, work and have for my free time activities.
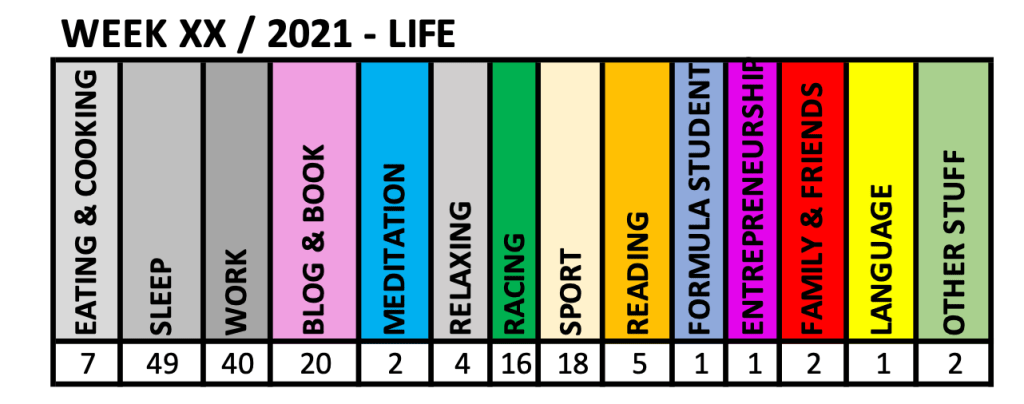
In this one, you can see basically the whole week including work, sleep and eating & cooking. But we all need some illustrations to make these numbers speak for themselves, right? Therefore, here is a much better way to show them.
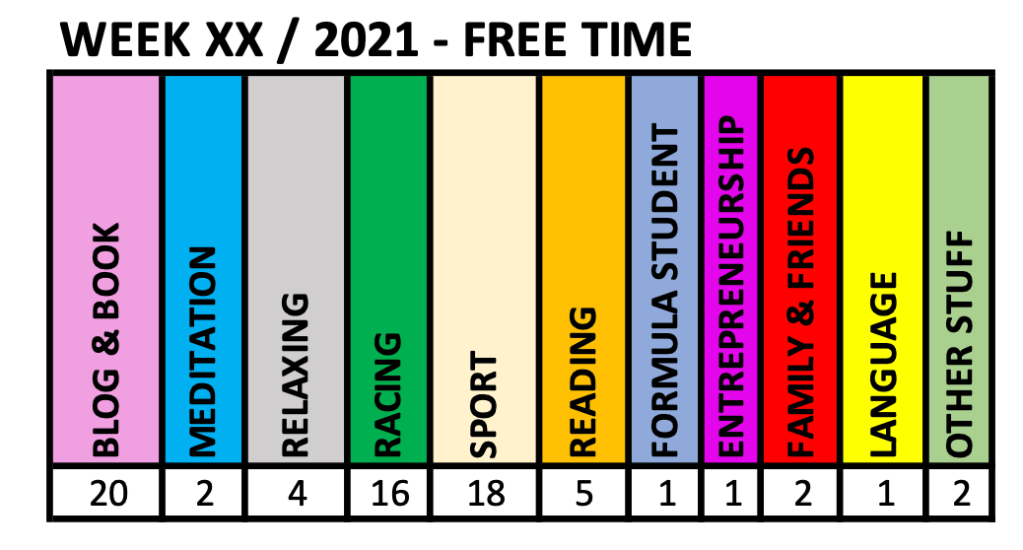
And with this added to the statistic, the following will focus on the free time specifically.
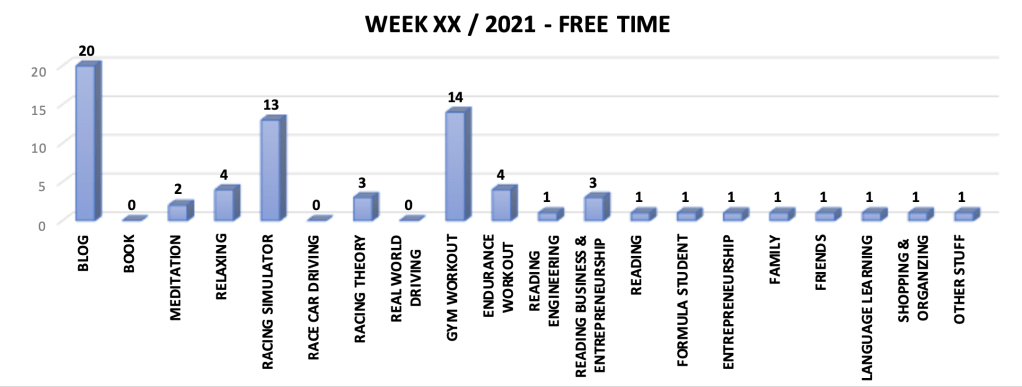
I am separating the free time from eating, sleeping and working as usual, because that is for the moment, the best thing to do. Sure, I don’t know where and how I will work in this new year 2021, but we will see! Maybe I can’t separate it any longer, I am not so sure yet. But of course I can change this anytime.
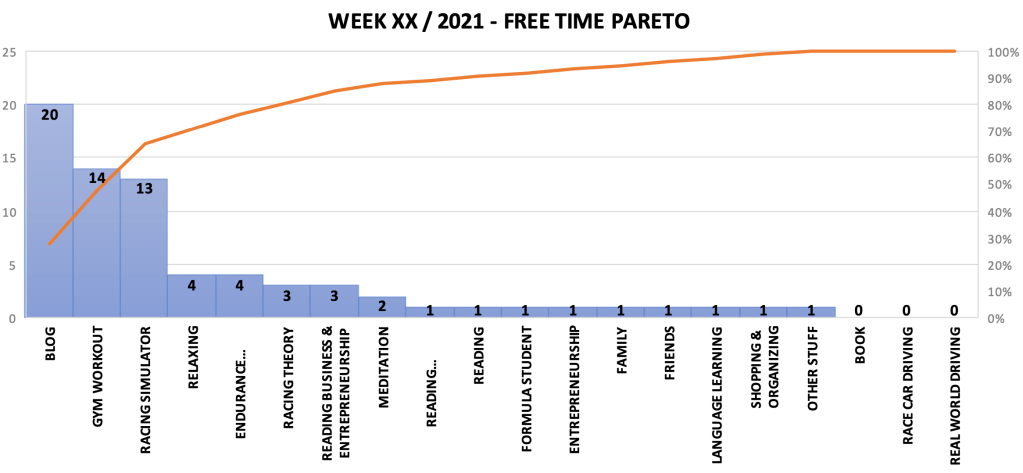
Sure, if you know what the Pareto or 80/20 principle really means, this chart makes absolutely no sense at all. But it is still a pretty good indicator for figuring out where I have spend the most of my free time with during a week. And that’s at least pretty interesting to me!
Well, that’s already it for the statistic update. As you can see, I will still keep it as simple as possible trying to let this statistic be what it is. An easy to use tracker of my time. Not more and not less.
See you next time!

Leave a comment